Debug End-to-End Tests like a Pro with Playwright
Automated end-to-end (E2E) tests are an essential part of software development. They help ensure that a web application works as expected from the user’s perspective and catch bugs and regressions early in the development process. However, debugging automated E2E tests can be challenging, especially when tests fail and you need to understand what went wrong.
In the previous article, we explored the process of creating tests with Playwright and discussed some best practices and different approaches for these tests. In this article, we’ll explore how to debug automated E2E tests using Playwright. We’ll take a look at some techniques for enhancing test reliability and explore the tools that ship with Playwright to help you debug tests when they fail.
Improving Test Reliability
Before we get into debugging, let’s take a look at some techniques for improving test reliability. Automated E2E tests are often flaky, meaning that they fail intermittently and inconsistently. It can be incredibly difficult to debug flaky tests because a flaky test will always pass when you run it by itself in debug mode, but will fail at random when run as part of a continous integration pipeline. This can be due to a variety of reasons, including network issues, slow page loads, and unexpected behaviors. Usually it is because Playwright is trying to perform an action before the application is in the proper state to support it. There are several techniques that you can use to improve reliability and reduce the number of false positives. I will show you the techniques that I have used to eliminate flakiness in my tests.
Setting Retries
This first trick will not eliminate flakiness, but it will allow your pipeline to continue if it encounters a false positive. By default, Playwright will not attempt to run a test again if it fails. However, by setting the retries property in the Playwright config, Playwright will retry any failed tests up to the specified number of times. Our applications at Limeade have retries set to 2, so if a test fails, Playwright will attempt to run it again 2 more times before it considers it as failed. If a test did in fact fail on the first attempt, Playwright will provide a warning in the console when it is finished.
Waiting for Everything to Load
For our tests, we created a utility function called waitForEverythingToLoad, which ensures that the application is in a proper state before continuing the test. We typically place this after DOM interaction and before assertions.
test('Filling out the lookup form and show user not found error', async ({page}) => {
  await page.goto('/register');
  await page.locator('h1:has-text("First, let\'s find your account")').waitFor();
  await page.getByRole('textbox', { name: 'Last name'}).fill('UserDanTestAccountA');
  await page.getByRole('textbox', { name: 'Date of birth' }).fill('01/01/2001');
  await page.getByRole('textbox', { name: 'Unique ID' }).fill('unknown user');
  await page.getByRole('button').filter({ hasText: "Find Account" }).click();
  await waitForEverythingToLoad({page}); // This is a utility function to improve test reliability
  await expect(page.getByRole('alert')).toHaveText(
    'The information provided did not match our records. Try again or click the help link for more information about finding your account.'
  );
});
This utility function ensures that the application is in a proper state before continuing the test:
export const waitForEverythingToLoad = async ({page}: {page: Page}) => {
  await page.waitForLoadState('networkidle');
  await page.waitForLoadState('load');
  await waitForFonts({page});
};

export const waitForFonts = ({page}: {page: Page}) =>
  page.waitForFunction(() => document.fonts.check(`1em Lato`));
The waitForLoadState function waits for the page to reach a specific state before continuing. The networkidle state waits until there have been no network connections for at least 500ms, and the load state waits until the load event has been fired when the page has finished loading. The waitForFonts function waits for the fonts to load before continuing.
We were able to eliminate the flakiness of our tests by adding this helper function. Fonts are a common source of flakiness in end-to-end tests, as they can take some time to load, and are usually the last thing to be loaded. By waiting for the fonts to load, we can ensure that snapshot tests will not fail due to the fonts not being loaded in time before Playwright takes the snapshot.
test('Loads landing page', async ({page}) => {
  await page.goto('/register');
  await page.locator('h1:has-text("First, let\'s find your account")').waitFor();
  await waitForEverythingToLoad({page});
  const screenshot = await page.screenshot();
  expect(screenshot).toMatchSnapshot('landing.png');
});
Locator.waitFor()
Notice in the previous example that we’re also waiting for the h1 text to be present via the Locator.waitFor() method. This is a means of forcing Playwright to wait for the HTML to be rendered before continuing, but it also allows for the test to fail early. If the test fails on this line, we can safely assume that the page did not render (assuming the h1 text did not change, that is) rather than waiting for it to fail on the snapshot comparison, then having to go and look at the rendered snapshot to see that the page wasn’t rendered.
Setting the Timeout
By default, Playwright will wait for 30 seconds before timing out on a test, and 5 seconds on an assertion. If your dev encironment is slow, or your test involves a lot of interaction and API requests, or there are a number of things that the application does before an assertion can be made, this may not be enough. The timeout can be set for a single test by passing the timeout option to the test function.
test('long test', async ({page}) => {
  test.setTimeout(50000);
  ...
});
Screenshots on failure
Playwright provides a feature to take screenshots automatically when tests fail. These screenshots can help you quickly understand what’s going wrong, especially when tests are failing due to UI issues like missing elements, incorrect styling, or unexpected behaviors. You can enable screenshots on failure by passing the --screenshots flag when running your tests. You can also set your screenshots to output to a specific directory through the Playwright config file like so:
const config: PlaywrightTestConfig = {
  outputDir: 'specs/.test-results',
  testDir: 'specs/',
  retries: 2,
  use: {
    video: 'on-first-retry',
    screenshot: 'only-on-failure',
  // ...
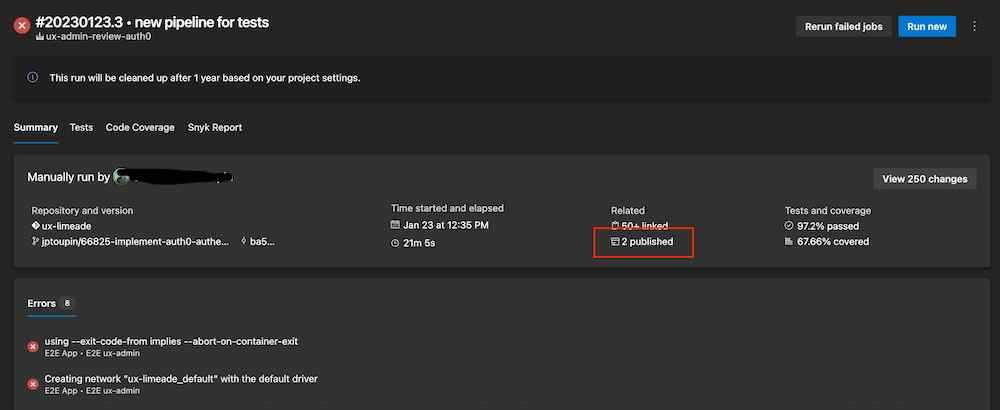
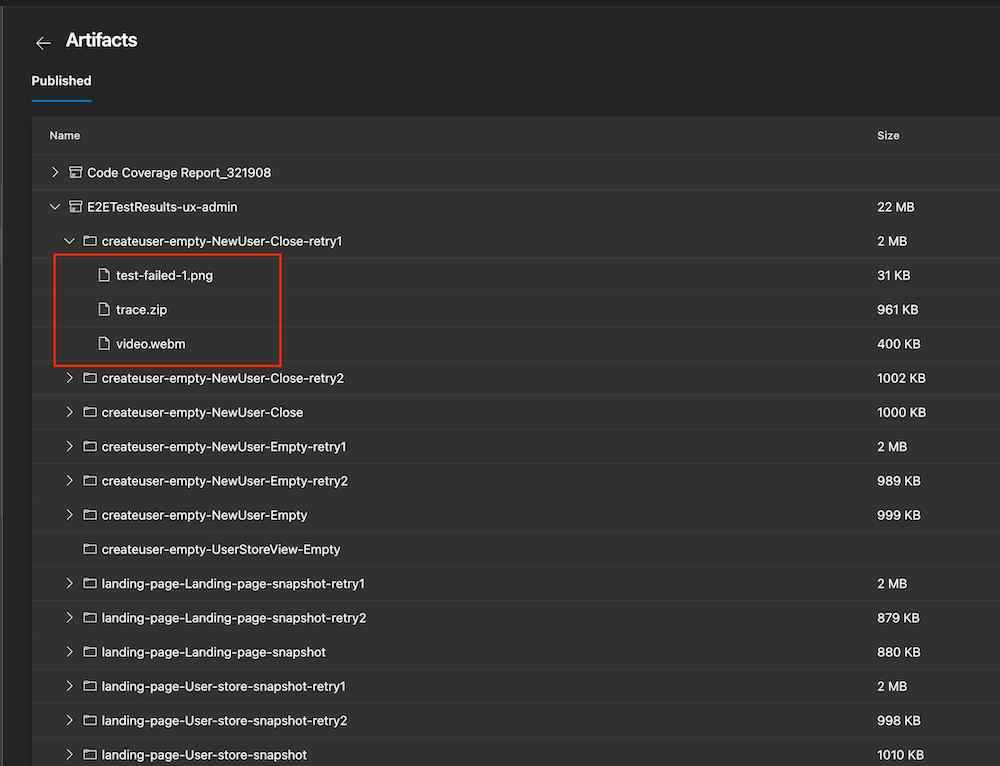
In this configuration, we are outputting the screenshots to the specs/.test-results directory, and we are only taking screenshots on failure. We are also taking a video of the test on the first retry, which is incredibly useful when you have a test passing locally and can’t figure out what went wrong in the CI pipeline. You can also setup your CI pipeline to generate this files as “artifacts” that can be viewed when the test run is complete.
Ours is setup so that when the CI pipeline fails due to E2E failures, we can download the video and screenshots from the pipeline in Azure DevOps and view them locally to see what went wrong.
Debugging snapshots
When a snapshot test fails, Playwright will generate a diff image that shows the differences between the two snapshots. However, it is worth noting that the diff image is not always very helpful. For example, if the text of a button changes, the diff image will show the entire button as being different. This can make it difficult to determine what exactly changed.
Local Debugging in the browser
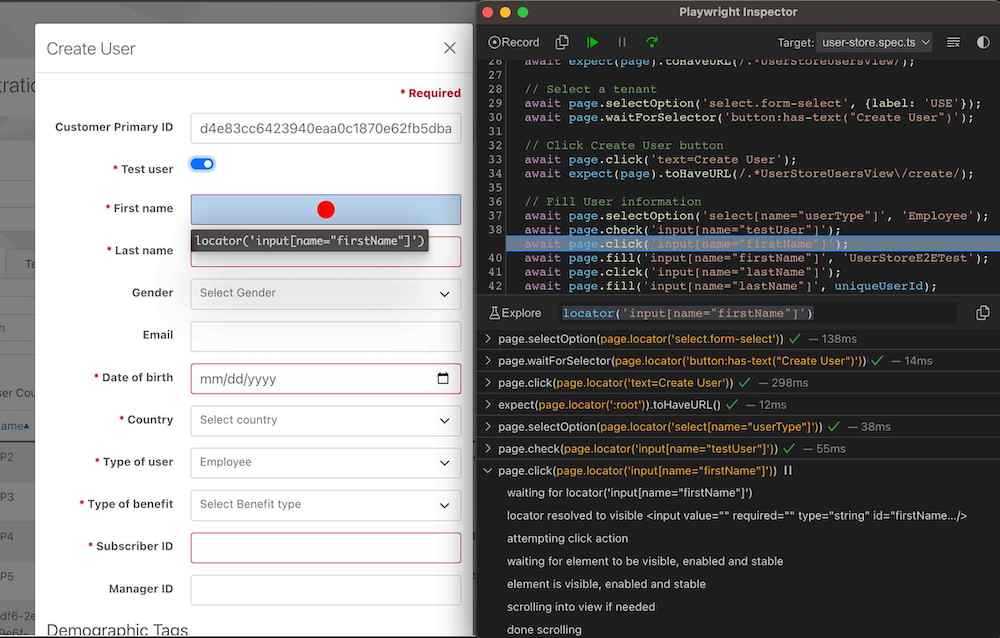
When Playwright tests run, they run in headless mode. When you run a test is debug mode however, it initalizes an incognito Chromium browser window and the playwright inspector. By appending .only to the test you want to debug and then running Playwright in debug mode, Playwright will only run that test, initializing a single browser window and inspector.
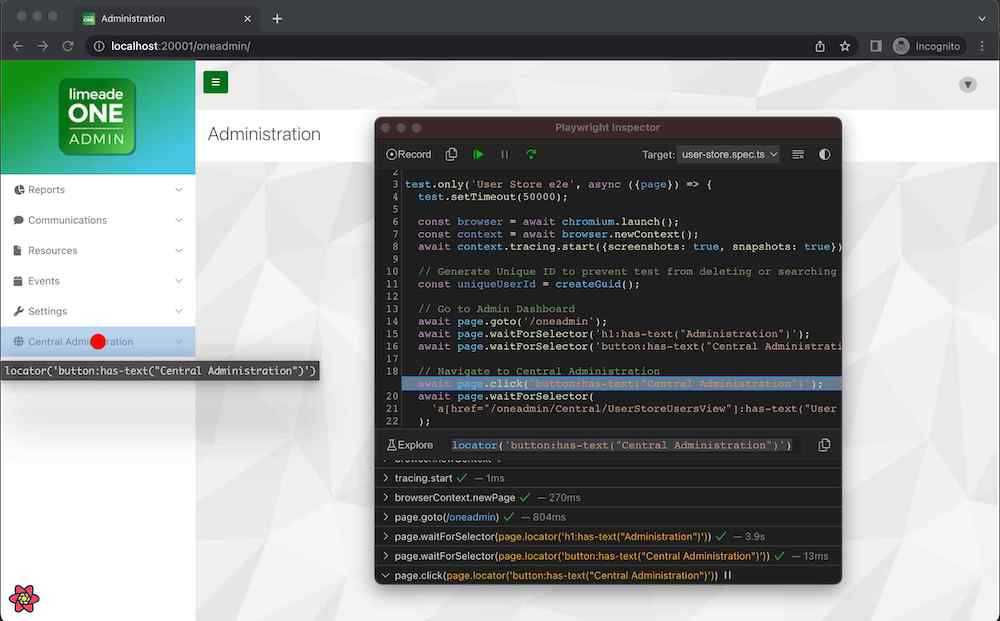
The browser window gives access to all of the dev tools you would expect, and the playwright inspector gives you access to the DOM, and the ability to pause the test, step through it, and inspect the state of the application.
Parrallel vs. Sequential Test Execution
By default, Playwright will run your tests in parallel. This is great for speeding up your test runs, but it can also make debugging tests more difficult. Playwright runs tests by default in parallel whether you’re debugging or not, so if you don’t append .only to the test, Playwright will initialize a browser window and inspector for every single test, which can be a bit overwhelming. You can run your tests sequentially by passing the --workers=1 flag when running your tests or set workers: 1 in the Playwright config file, which will make debugging easier.
In some cases you may always want to run certain tests sequentially. An example of this might be creating a user, then editting that user, then deleting the user. If you run these tests in parallel, you may run into issues where the user is deleted before the edit test runs, or the edit test runs before the create test runs.
Using the Trace Viewer
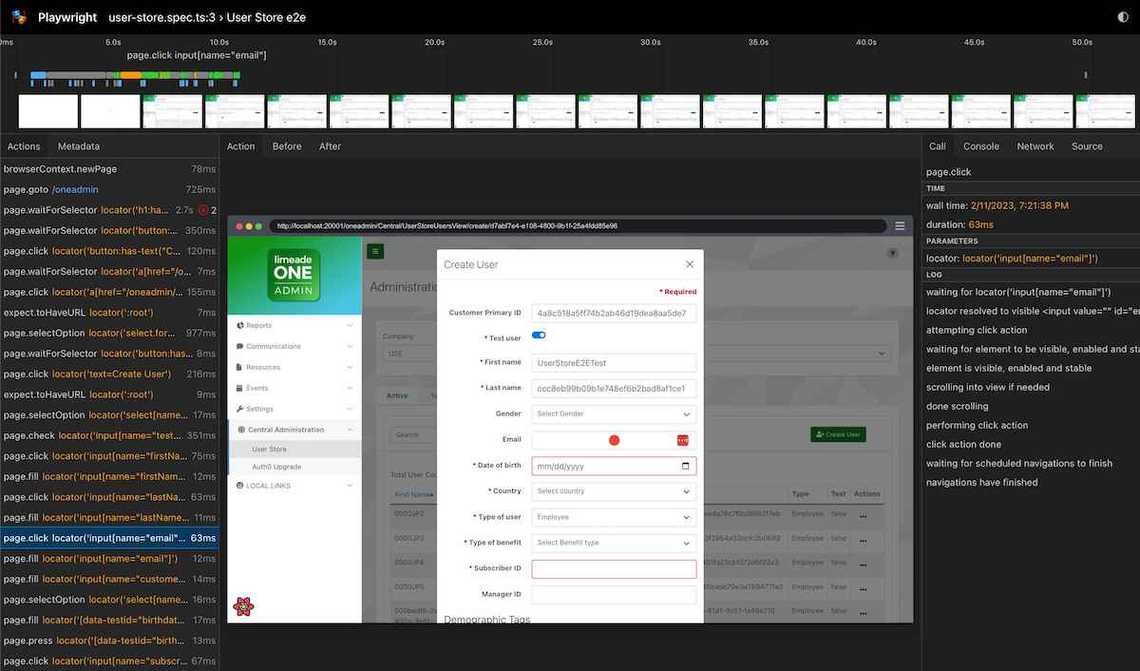
The Trace Viewer is one of the coolest things about Playwright. It allows you to move forward and back through a timeline of the test run and see what happened at every step, including network requests, interactions, console logs, and screenshots. You can also use the Trace Viewer to see what the DOM looked like at any point in time during the test.
The first step to using the Trace Viewer is to add the trace property is added to the use object in the Playwright config file.
const config: PlaywrightTestConfig = {
  outputDir: 'specs/.test-results',
  testDir: 'specs/',
  retries: 2,
  use: {
    headless: true,
    viewport: {width: 1_280, height: 720},
    video: 'on-first-retry',
    trace: 'retain-on-failure', // export the trace on failure
    screenshot: 'only-on-failure',
  },
  //...
This will export a zip file when the test fails, which can be opened in the Trace Viewer.
Note: You can also generate the trace file by passing the
--trace onflag when running the test.
The next step is to add a couple lines to the test you want to have the trace exported from.
test.only('Test for tracing', async ({page}) => {

  const browser = await chromium.launch();
  const context = await browser.newContext();
  await context.tracing.start({screenshots: true, snapshots: true});

  // ... test code

  await context.tracing.stop({path: 'trace.zip'});
});
The trace viewer can be opened by running the following command in the terminal:
npx playwright show-trace trace.zip
Alternatively, you can open trace.playwright.dev and drag and drop the zip file into the browser window.
VS Code Extension
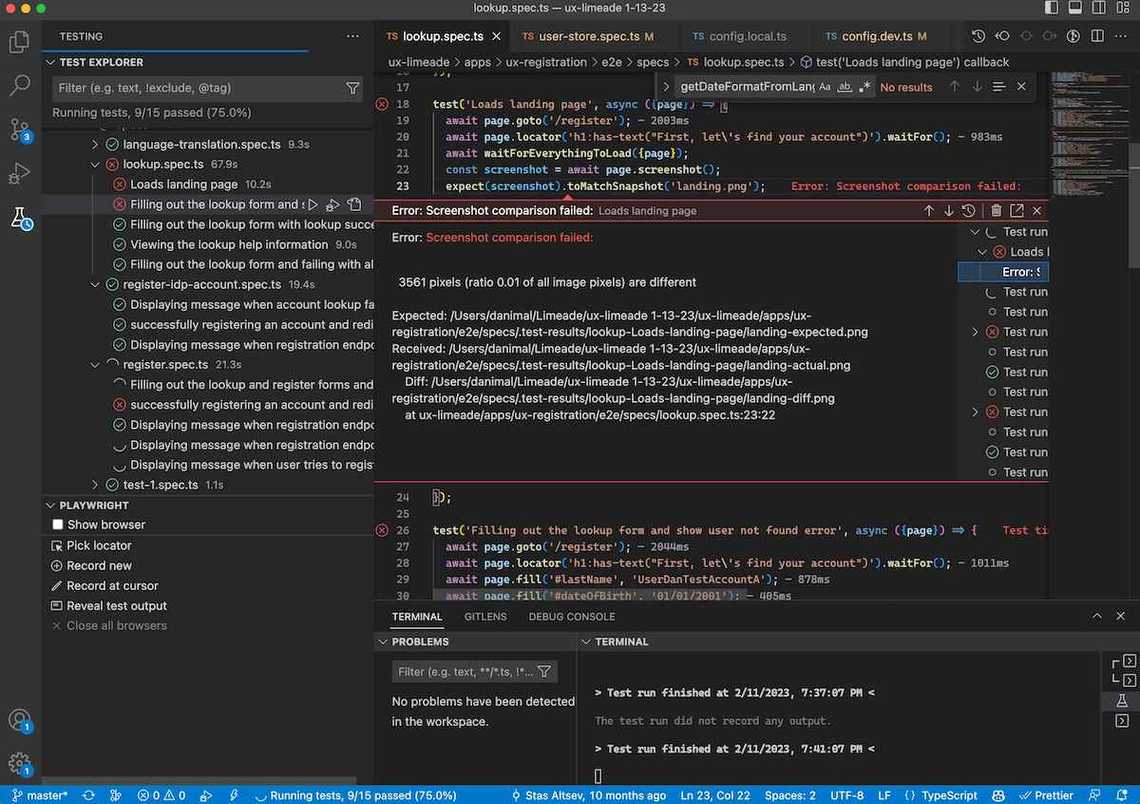
Playwright has an extension for VS Code that provides a number of useful features for debugging tests. The extension can be installed from the VS Code Marketplace. It allows you to navigate, run, and debug individual tests from the explorer, perform Playwright actions directly from VS Code.
Conclusion
Debugging automated E2E tests can be challenging, but knowing how to use the tools and techniques described here, it can be a straightforward process. Playwright provides a simple and intuitive API for automating browser testing and offers features like screenshots on failure, debugging in the browser, logging and debugging messages, and automatic waiting and timeouts, making it easy to debug tests when they fail. Whether you’re an experienced developer or just starting out, Playwright is a great choice for automating your E2E tests and ensuring that your web application works as expected.

